Code Execution
Don't confuse the Java stack with the stack trace in errors. They aren't related at all.
The Java stack is used only in interpreted mode.
Each app thread in the JVM has its own execution engine instance. It runs the app byte code.
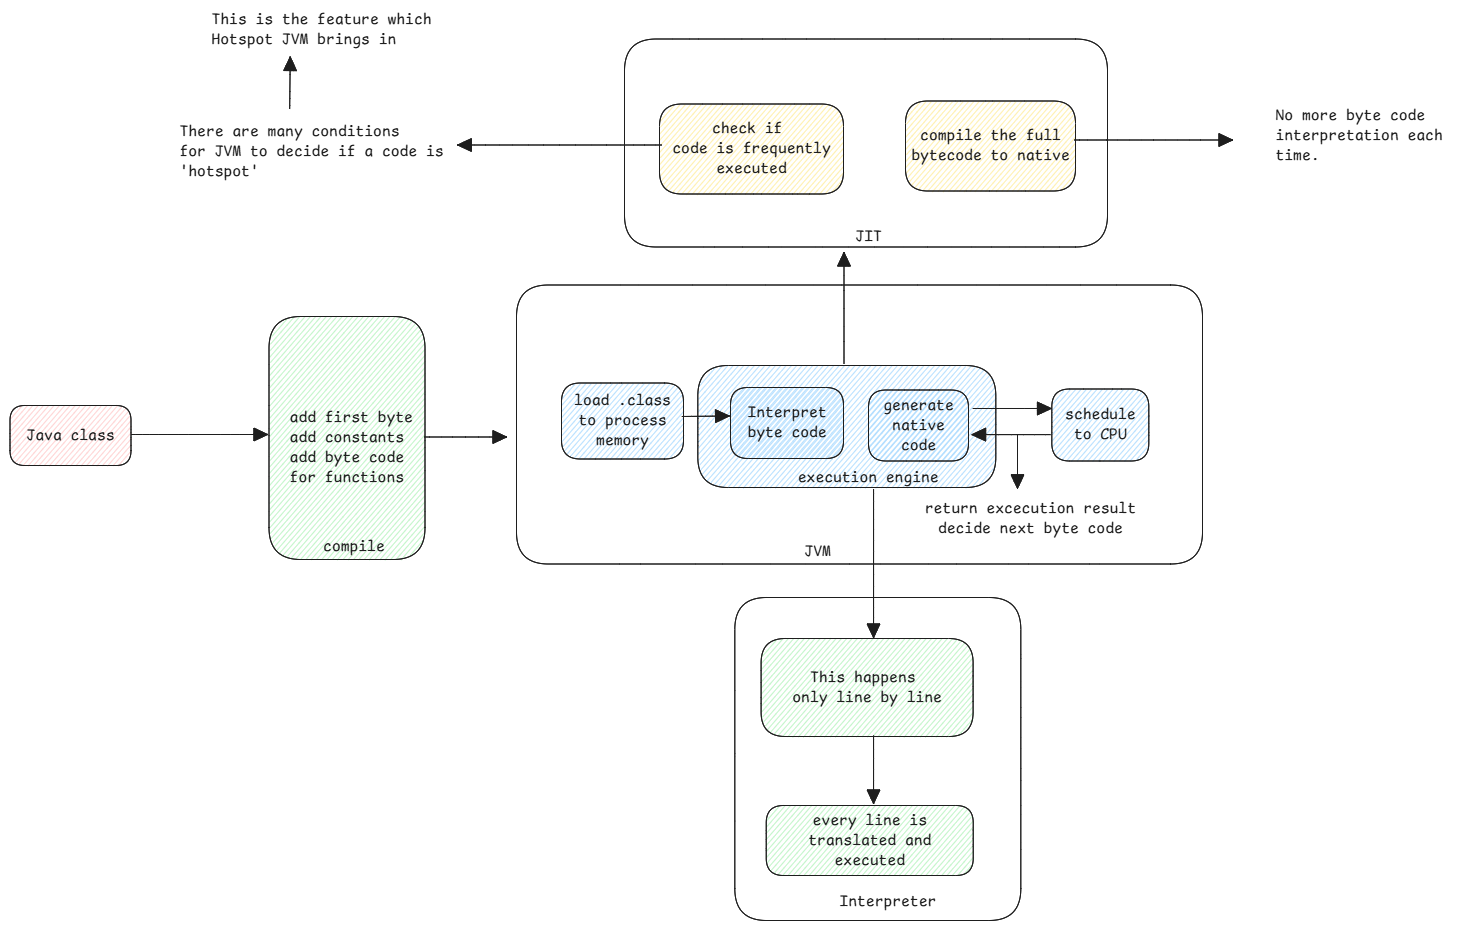
Java code runs in two modes: interpreted and JIT compiled. The JVM can switch between them smoothly.
Interpreted Mode
This is an infinite loop. The JVM reads the byte code and runs it one instruction at a time. It's native compiled code with a large switch case. For each byte code instruction, it runs a set of native instructions.
Read the interpreter page for more details on how the interpreted mode works.
JIT Compiled Mode
Here the JVM compiles the byte code to native code and then executes that native code directly.
In this mode, the Java stack isn't used at all. The native code and the native stack run the execution.
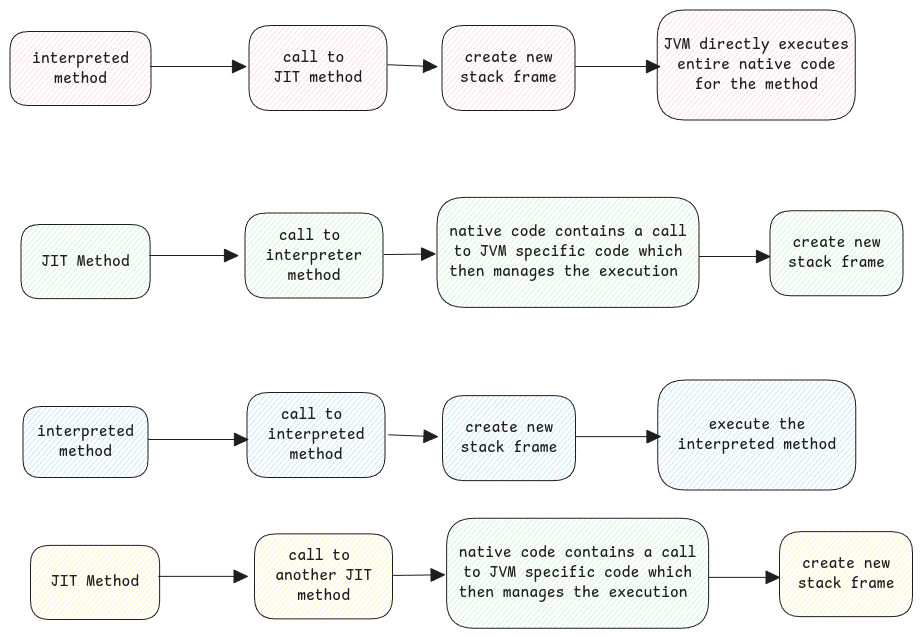
Integration between two modes
Often, not all methods are JIT compiled. Some are interpreted. The JVM can switch between the two modes smoothly.
The stack trace in error logs is a logical view of the flow. It need not match reality.
It turns the internal state into a readable view of how Java methods were called. That state includes native code, interpreted byte code, and layers like method inlining or JIT optimizations.
IDEs use the JVM's debugging APIs to show this logical stack trace.
Local Variables Stack
Every stack frame in a JVM thread stack has its own local variables stack.
When a method is called, its arguments are pushed onto the frame's local variables stack. The JVM reads this and copies it to the local variable area of the new stack frame. When the method returns, the JVM copies the result to the operand stack of the calling frame.